A chart reads data from a datasource and renders it as a graphical display which sizes to fill the view it is placed in. The datasource chosen may be identified by a repository URL, in which case the content is fixed, or the datasource may be reading from another view, in which case the chart will be updated automatically each time the other view is modified.
There are many parameters that can be used to configure the presentation of the chart, most importantly what type of chart is required. The chart wizard and range of available charts and options is described in the Elixir Report Designer manual.
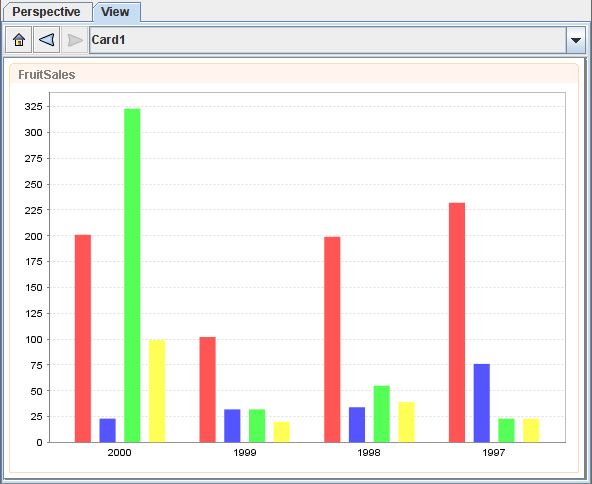
Bar, column, area and pie charts have selectable regions corresponding to the chart shapes. For example, clicking on a bar will select all records that contributed to that bar. You can create another view which uses this selection as a filter to control its display. You can also attach actions, so that clicking on a bar will show a new view or card which is mapped to the selection made. This is an easy method of creating a drill-down chart.
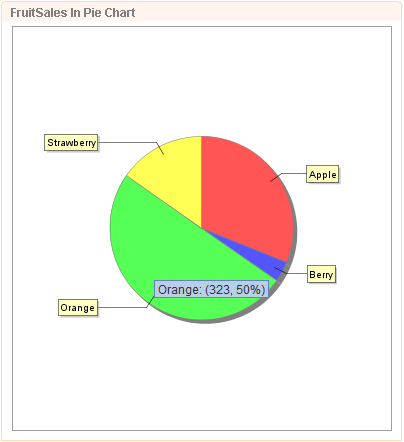
Pie Chart supports mouse-over and explode slices. In order for the Pie Chart to display the containing values when the mouse rolls over, the following scripts are required to be inserted under the Script tab of the Edit Content Wizard :
importClass(Packages.org.jfree.chart.labels.
	StandardPieToolTipGenerator);
plot.setToolTipGenerator(new StandardPieToolTipGenerator());
After the changes are being applied, the value of the particular slice of the pie will display its value when the mouse rolls over, as shown in Figure 2.7, “Mouse Roll Over Pie Chart”
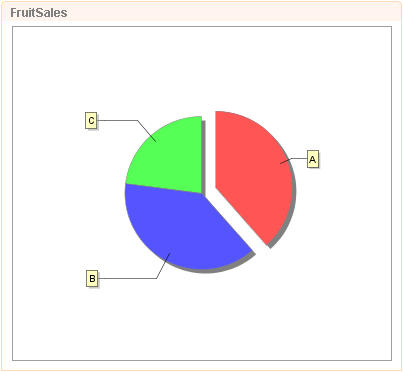
In order to explode the slice of a Pie Chart when clicked, as seen in
Figure 2.8, “Pie Chart Explode Slice”, enter a figure in Explode Percent
in the Pie tab of the Edit Content Wizard. This figure represents the
degree of "explosion" of the slice, meaning the space between the exploded slice
and the pie chart.
Available datasources: All, Selected, Unselected (only for bar, column, area and pie charts).