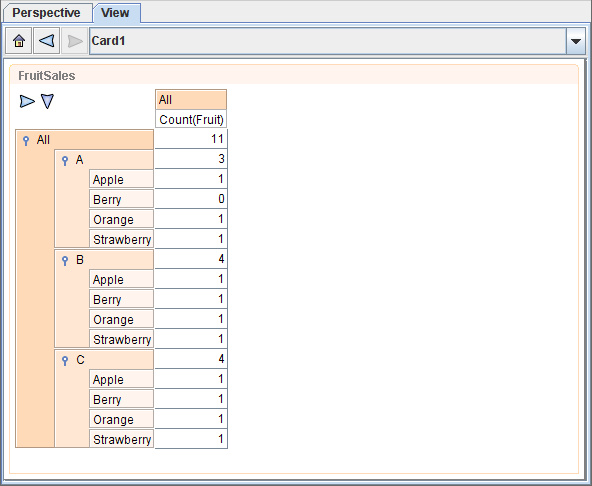
A cube table reads data from a datasource and renders a two-dimensional
table showing the values derived from those records that form the intersection
of the two dimensions. There are two ways in which a cube table can be designed.
The Cube Table wizard provides a step-by-step dialog to guide the design process.
This is identical to the wizard used in Elixir Report Designer and is described in that
manual. The other approach is to create an empty cube table using
the wizard (just click Finish after choosing a datasource)
and designing the cube interactively. This approach is usually preferred because
each change to the cube is immediately reflected in the view.
Similar to a Cube element in report template and Cube processor, Cube Table in a dashboard is able to
Show Row Grand Totals, Show Column Grand Totals,
Row Totals After Details and Column Totals After Details.
To change the settings of the Cube Table in a dashboard, click on the arrowhead pointing downwards.
The respective settings can be found in Cube Options.
More information about Cube can be found in Elixir Data Designer.pdf, Chapter 4. Composite Datasource,
the section on Cube Processor.
If the cube data is required for subsequent processing, it is possible to save the cube table contents into a CSV, DataSource, Excel or XML file.
Available datasources: All, Selected, Unselected.