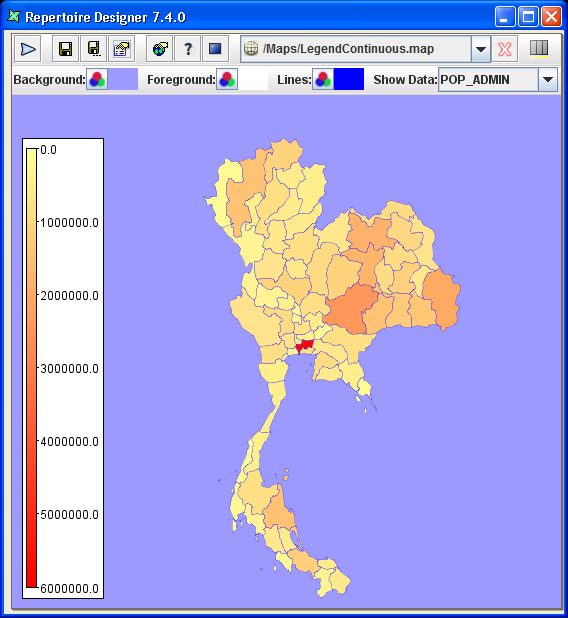
Legend will appear as a box on the map, to show the contents (in the form of text or continuous range format) of all the regions.
In the case of Figure 4.3, “Colouring Algorithm - Gradient 2”, the population size of all the regions are shown in the Legend box. Therefore, the map might not look presentable. By enabling the Continuous option, the legend becomes smaller and shows only a range of blended colours with default major tabs.
Start At Zero option is a preference whether to show
the range from zero or from the a rounded up figure nearest to the
minimum and maximum 'fill-regions' data.
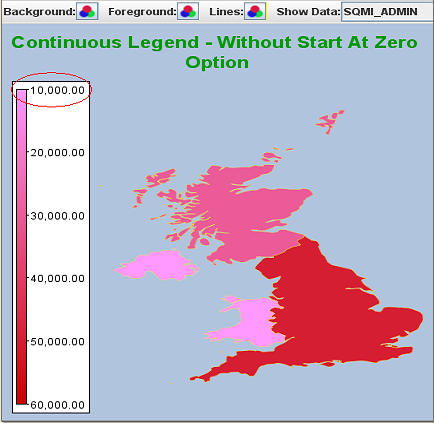
Note
- The Continuous and Start At Zero option can only be used when you select a numeric field name.
- The Start At Zero option will only be effective when the Continuous option is enabled too.