If the base map has “fill-regions” data and a particular Colouring Algorithm has already been setup, user can now preview the map with data.
Drag a datasource (the base map .ds file is a good place to start) to anywhere within the Map view and drop it. This is to populate
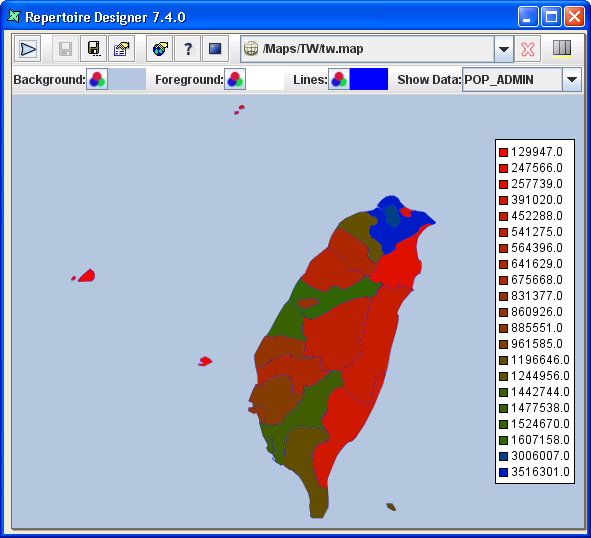
Show Data:with the data from the .ds file.Select the field name in the drop down list to activate the Colouring Algorithm type chosen. The result will be similar to Figure 2.10, “Map After Show Data”.
Tip
If a “text” legend is required, user can use GMI_ADMIN as the next best option to describe all regions on the map.
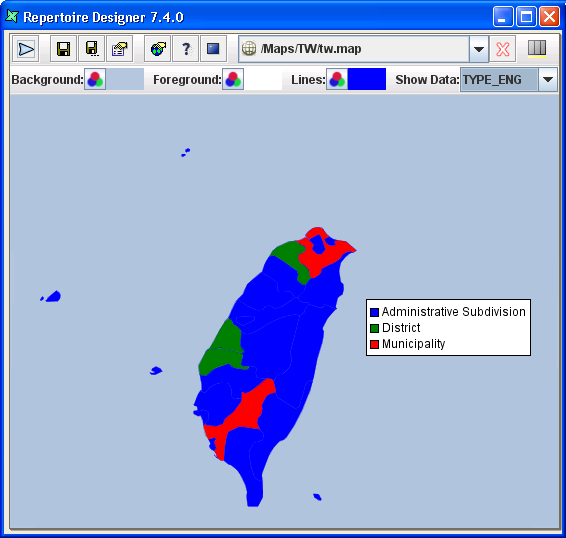
When the mouse cursor hovers over any one region, the region's name will appear, as seen in Figure 2.10, “Map After Show Data”. User can select any field name to experiment how the map will appear with each selection.
Tip
In this example, an interesting field name, TYPE_ENG, shows a group of regions under a specific category. Thus, when selecting this field name, user can see that a number of regions are classified under the same colouring tone instead. In this case,
Legendis best used to display in order to identify all the categories for each region.Note
GMI_ADMIN and TYPE_ENG are common field names found in many .dbf files. There are also some .dbf files which do not have such field names or have the same data with different field names.On the top of Elixir Workspace, there are optional formatting tools to help further to enhance the image of your map.
- Background option : Select the colour to appear outside the base map area.
- Foreground option : Select the colour to appear inside the base map area.
- Lines option : Select the colour for the outline of the regions
Tip
- The foreground colour is useful for specifying regions which do not have "fill-regions" data in the .ds file. It helps to contrast the rest of the coloured regions.
- It is also useful for a base map whose purpose is to show map layers clearly. Thus, the foreground colour should be one that can bring out the clarity of the points on the base map. (Refer to the section called “Map Layers”).