The purpose of this case study is to demonstrate the way to use a SWF element as a table and displaying the data selected.
-
In a newly created perspective, drag FruitSales.ds into the
blank space and select
Add Table. -
After clicking on
Nextonce, click onFinish. - Next, drag the Table.swf to the bottom of the table. This file can be found in ElixirSamples/Dashboard/SWF Dashboard/swfs/.
-
The Add Content window will appear. Click on the
Viewtab and select FruitSales andSelected. This will mean that the SWF element will display according to the data selected from the table created using FruitSales.ds. -
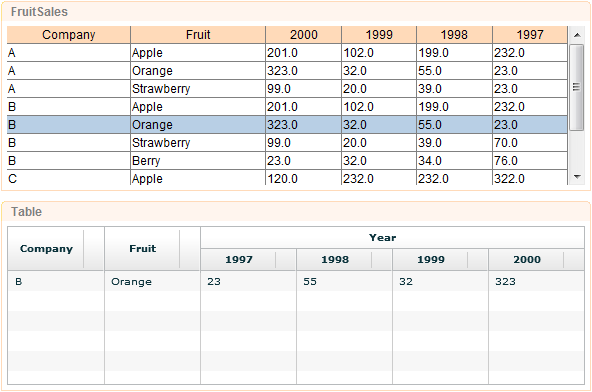
After 5 clicks on
Next, user needs to enter the respective names for the columns. Enter a parameter name, for example, columns for theNamefield. ForValue, enter the followingCompany|Fruit|{Year:4}|1997|1998|1999|2000The above line will split the table into 6 different columns, with names Company, Fruit, 1997, 1998, 1999 and 2000. Rows 1997, 1998, 1999 and 2000 are split into 4 columns, with Year as the heading. -
Click on
Finishto complete the creation. - To see the SWF element, it has to be opened from Repertoire Server web interface. When the Perspective is opened, it will look like Figure 2.24, “SWF Chart”.