
Composite Chart is an advanced version of the Chart element. It allows multiple charts to be displayed in a single chart. Composite Chart creates a combination chart or chart with multiple axes. Area, Column and Line Charts can be combined.
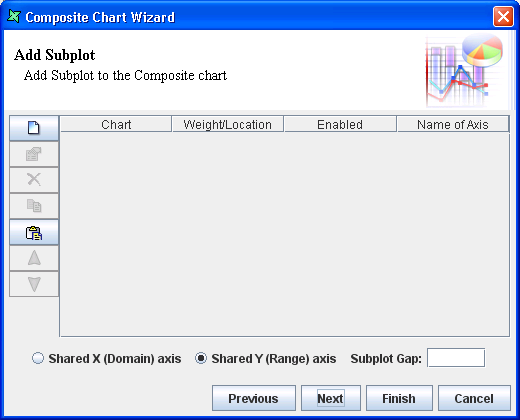
Adding a subplot adds an additional chart into the Composite Chart. The creation of each subplot is similar to the process of creating a convention Chart element. The only difference is that the process is more simplified with fewer chart types. In the section called “Case Study 1 - Composite Chart” is a sample of creating a simple Composite Chart element.
Note
Retain Key Order is available in Composite Chart.
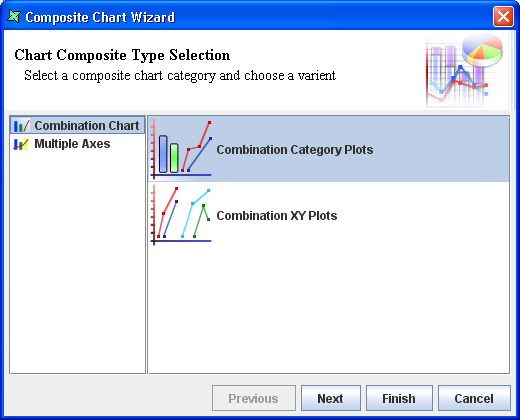
Combination Category Plots allows the display of 2 or more Area, Column and
Line Charts together side by side. Multiple XY Charts can be achieved by
selecting Combination XY Plots.
The figure to be entered for Weight/Location determines
the proportion of the chart. Subplot Gap determines the
amount of spacing in between each chart. The value is in terms of pixels.
Multiple Axes displays 2 or more Area, Column and Line Charts together by overlapping each other while sharing either the X-axis or the Y-axis. When one axis is shared, the other axis will have additional axis depending on the number of charts in the Composite Chart. When the X-axis is shared, the location will be either right or left. If the Y-axis is shared, the location will be either top or bottom.