Elixir Data Designer provides a Cube component which allows you to generate data results of the your choice by defining multi-level dimensions and multiple measures using the pre-defined functions like sum, average, count, max, min, etc.
The Cube processor is selected from the menu bar of the Designer window and then placed in the designer window workspace.
The properties of the Cube processor are given below.
Properties
On opening the properties of a Cube processor, the dialog appears as shown in Figure 4.47, “Cube Wizard”.
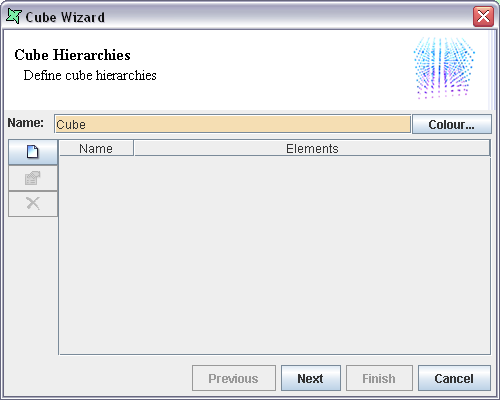
The Cube Hierarchies screen contains the Name and Elements column where the names of each hierarchy and the corresponding hierarchy elements will be listed.
There are three buttons on the screen namely Add, Edit and Remove which can be used to add, edit or delete a hierarchy.
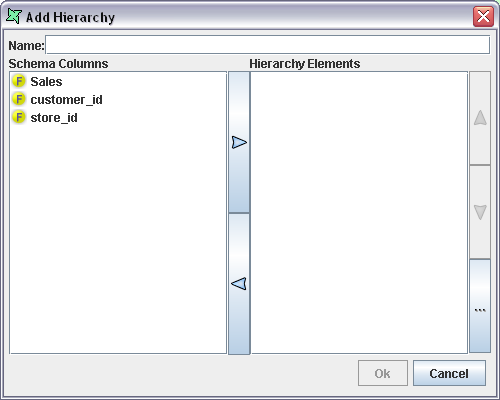
On clicking the Add button, the dialog box pops up as shown in Figure 4.48, “Add Hierarchy”, where the hierarchy elements can be added and a name can be assigned to the hierarchy. A hierarchy indicates a strict relationship between the hierarchy elements - each child can only belong to a single parent. For example, "Country/State/City" is a valid hierarchy because a City can't be in more than one State, and a State can't belong to more than one Country. "Year/Month" is not a valid hierarchy, because "January" can occur in many years.
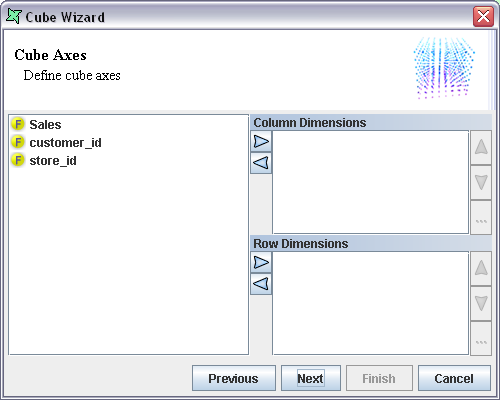
On clicking the Next button, in the Cube Wizard appears as shown in Figure 4.49, “Cube Axes Screen”. In this screen, the Column dimensions and Row dimensions can be added. The elements that are added in the Column dimension windows will be displayed as the column fields in the output table. The elements that are added in the Row dimensions window will be displayed as the row fields in the output table. The hierarchy column added in the first screen can be made use of in this screen as a row or column field. Use of a hierarchy is more efficient, as the system relies on the strict definition of each child only having one parent. However an incorrect use of hierarchy, as illustrated by "Year/Month" above will usually yield incorrect results.
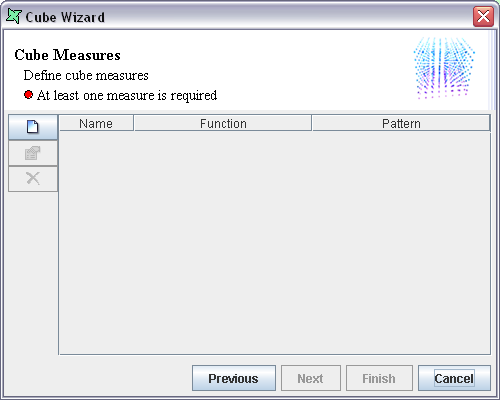
On clicking the Next button, the Cube Wizard appears as shown in Figure 4.50, “Cube Measures Screen”. There are two columns namely Name and Function. In this screen, the Pre-defined functions and the name of the fields using these functions will be listed. There are three buttons namely Add, Edit and Remove to add, edit or remove the cube measure columns.
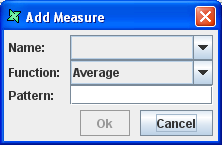
On clicking the Add button, the dialog box pops up as shown in Figure 4.51, “Add Measure Dialog”. In this dialog box, the Field name, Function and Pattern can be selected. Each measure applies a function to a particular field, for example Average(Salary). The name of the measure is given by the values of the dimensions that form the output column. For example, Male/Average(Salary) and Female/Average(Salary) would be the column names for a Cube with a Gender column dimension. If there are two dimensions, e.g. Country/Gender then you would get column names like Singapore/Male/Average(Salary).
Sometimes you might want to choose your own column names. This is where the Pattern field is useful. By default, if you leave the Pattern field blank, you will get column names as described above. If you enter a Pattern description, it will be used to generate the column names. There are a number of substitution parameters available. Assuming the default column name was US/Oregon/Married/Count(employeeid), here are some samples of the available substitutions:
[blank] -> US/Oregon/Married/Count(employeeid) // backwards compatible
${*} -> US/Oregon/Married/Count(employeeid) // all, as before
${0} -> US // extract using index
-${1}-${0}-${2}- -> -Oregon-US-Married- // another index e.g.
${hierarchy} -> US/Oregon/Married // without the measure
${measure} -> Count(employeeid) // without the hierarchy
${hierarchy}/${measure} -> US/Oregon/Married/Count(employeeid) // all
${field} -> employeeid // just the field name
${fn} -> Count // just the measure fn
${fn} of ${field} -> Count of employeeid // varying formatting
Note
It is important that any pattern you define should result in a unique column name for each column in the cube. This usually means that you should include the elements of the hierarchy and the measure somewhere in your pattern. Failure to ensure unique column names may prevent subsequent processor steps from accessing data from those fields with duplicate names.
The next wizard page provides a few options to tune the cube process and output:
Collapse Empty Rows This option will remove any rows from the cube that have no records contributing to them. For example if Singapore/Male has no records, then only Singapore/Female would be shown. If empty records are not collapsed the output will be a permutation of non-hierarchical row dimensions. Hierarchies by definition (see strict hierarchies above) do not have empty rows.
Collapse Empty Columns This option will remove any columns from the cube that have no records contributing to them. Note that use of this option will alter the output schema - the columns indicate the fields each record will contain. Care should be taken when using this option as errors will result if subsequent steps depend on the presence of columns that are removed. The only benefit in removing empty columns is to improve presentation. For example, users of Elixir Report Cube Table can make use of this option to better utilize the available width of the report.
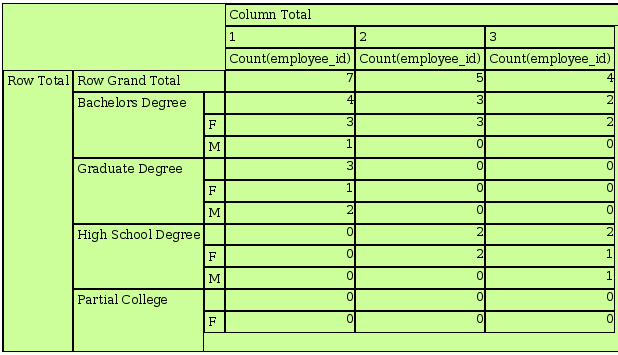
Show Row Grand Totals When outputting records to subsequent processors, or Result, an additional row is inserted to represent the grand totals of all the rows in the same column. Here's an example:
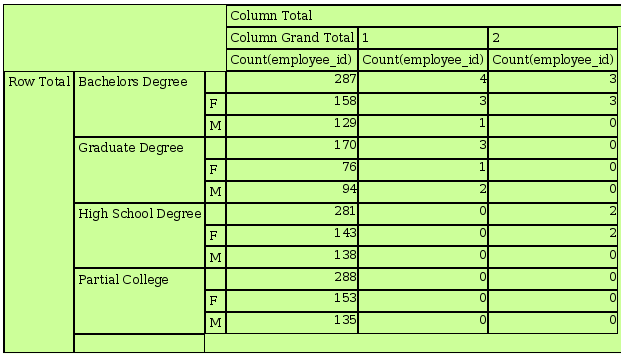
Show Column Grand Totals When outputting records to subsequent processors, or Result, an additional row is inserted to represent the grand totals of all the columns in the same row. Here's an example:
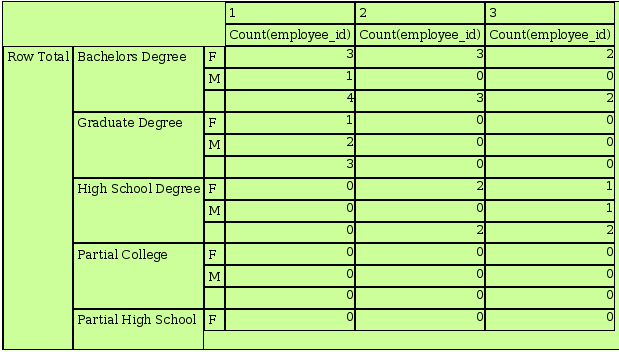
Row Totals After Details Similar to Show Row Grand Totals, this option sums the total, but only after the row(s) of each group of Measure(s), as shown in Figure 4.54, “Cube - Row Totals After Details”.
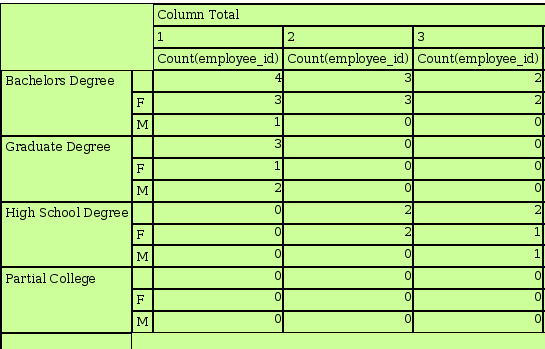
Column Totals After Details This options works the same way as Row Totals After Details. The only difference is that this option creates shows the total before each group of Measure(s), as shown in Figure 4.55, “Cube - Column Totals After Details”.
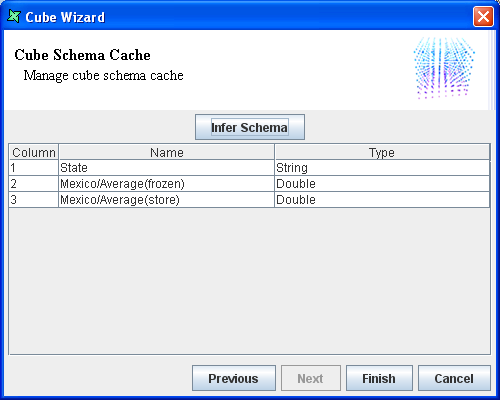
On clicking the Next button in the Cube Wizard the Infer Schema screen appears. The schema can be inferred by clicking the Infer Schema button. You should infer the schema after any changes to the dimensions or measures, including changing the measure patterns, because all these affect the column names.
Note
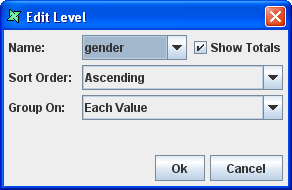
In order for Row Totals After Details and Column Totals After Details to display when generating the Cube,
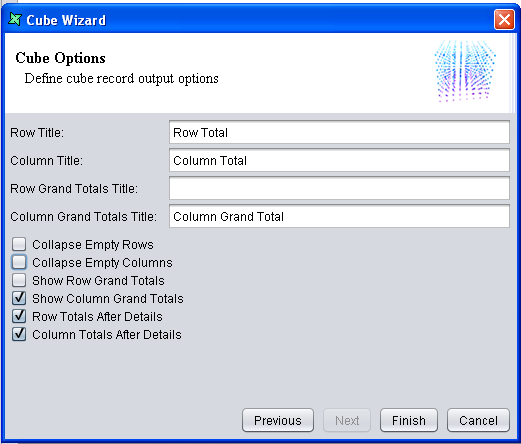
Show Totalsmust be selected, as shown in Figure 4.56, “Cube Axes - Edit Level”. As for Show Row Grand Totals and Show Column Grand Totals, it is not necessary to check the optionShow Totals.In order for Row Totals After Details, Column Totals After Details, Show Row Grand Totals and Show Column Grand Totals to display when generating the Cube, corresponding check boxes must be selected and titles must be entered, as shown in Figure 4.57, “Cube Options”
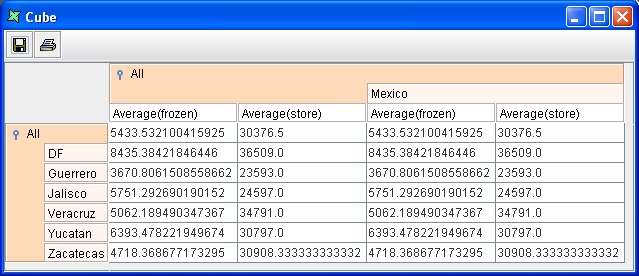
The averages of frozen and store for the stores in the different states of Mexico have to be compared.
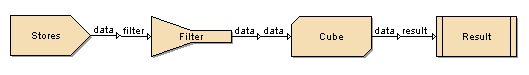
Add the JDBC data source Stores.
Add a Composite DataSource named
Cubeand drag the Stores data source over the diagram.Select a filter and place it in the designer. Next add a cube and connect the Stores to the filter, then to the cube and finally to Result. The diagram appears as shown in Figure 4.58, “Sample Cube Flow”.
Open the filter properties and configure it to keep Country equals Mexico.
In the Cube Properties, go to the Cube Axes page, select Country as the cube column and State as the row. On the Cube Measures page, add a measure to Average the field frozen and add another measure to Average the store field.
Click the Next button and infer the schema. The screen appears as shown in Figure 4.59, “Infer Schema Screen”. Click the Finish button.
From the Cube popup menu, choose View Cube. The output appears as shown in Figure 4.60, “Cube Result”. The averages of frozen and store for different states in Mexico are displayed.