
The Derivative processor is used to derive one or more new columns through computations on existing fields present in the data source.
The Derivative processor is selected from the menu bar of the Designer Window and then placed on the diagram.
Properties
The editable properties are shown in Figure 4.21, “Derivative Wizard”.
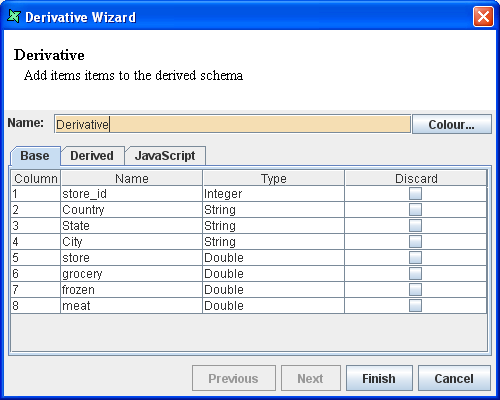
There are three tabs in the Derivative properties: Base, Derived and JavaScript.
The Base tab will display all the fields present in the data source connected to the Derivative processor input.
In the Derived tab there are 4 columns, Column, Name, Type and Value which contain input data required for deriving the new column.
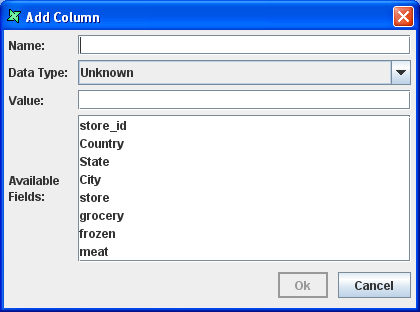
On clicking the Add button, the dialog box pops up as shown in Figure 4.22, “Add Column Dialog”. The following options are available.
The name of the new column must be entered in the Name text box.
The data type of the derived column will be selected from the combo box.
The formula that will be used to derive the column or the JavaScript function name used to perform computations will be entered in the Value text box. On clicking the Ok button in the Add Column dialog box the derivative column is added to the Derivative Wizard.
If more complex JavaScript functionality is needed then the code can be entered in the Derivative JavaScript tab. Note that any functions defined within this tab are only used within the scope of the Derivative - they can't be accessed elsewhere. If you need functions to be available throughout all uses of JavaScript, they should be defined on the Composite Diagram Script Tab instead.
Highlighting row(s) in
Basetab and right-clicking on it gives the option to add the selected row(s) to theDerivedtab. Column name(s) containing spacing or symbols will be contained within square brackets with open and closed inverted commas, [""] automatically when moved over, but the Value of the column will have to be done manually.
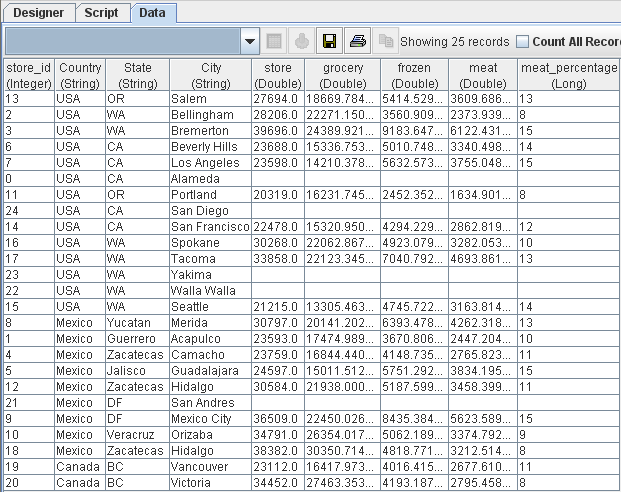
Here's how to derive two new columns from the Stores data source using the Derivative processor:
Add a JDBC data source, Stores, to the repository.
Add a Composite DataSource to the repository and open it.
Select Stores.ds, drag it into the Composite diagram and drop it.
Add a Derivative processor.
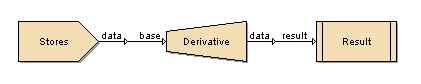
Connect Stores.ds to the Derivative processor and connect the output to Result. The designer window appears as shown in Figure 4.23, “Sample Derivative Flow”.
Deriving a new column using a formula
Here's how to calculate the percentage of meat available in the stores:
After connecting the stores data source with the Derivative processor using the Derivative procedure given above invoke the Derivative Wizard by double clicking on the Derivative processor.
The fields available in the data source are listed in the Base tab.
Select the Derived tab. In this window click the Add Column button. The Add Column dialog box appears.
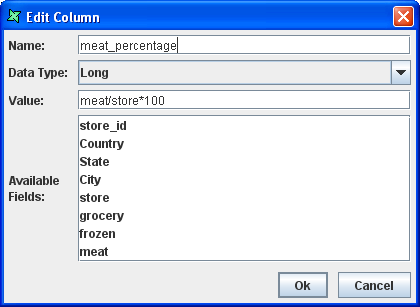
Enter the name as
meat_percentagein the text box provided.Select the Data type of the column as long.
Enter the formula
meat/store*100
in the value text box. The dialog box is shown in Figure 4.24, “Completed Add Column Dialog”.
Click the OK button and the column is added to the Derived tab window.
Click the Finish button and view the Result.
The output is shown in Figure 4.25, “Derived Result”. A new column meat_percentage has been added to the datasource, displaying the percentage of meat space available in the stores.
Deriving new columns using the various Date functions
Date manipulations usually require values such as 5 days ahead, 3 years ahead, 20 days before and 5 months before to be calculated.
Just like the previous illustration, connect Stores.ds to a Derivative processor.
After connecting, open the Derivative processor by double-clicking on the processor or right-clicking on it and select Properties.
The fields available in the data source are listed in the Base tab
Select the Derived tab. In this window, click the Add button.
Enter the name of the column as
Ahead_5_days. Select Date as the Data Type. EnteroffsetDays(first_opened_date,5);
in the Value text box. This function will calculate 5 days ahead of the day in the given date. Click the OK button. The "Ahead_5_days" column is added to the Derivative Wizard.
Click the Add button, the Add Column dialog box pops up. Enter name of the column as
Ahead_3_years. Select Date as the Data Type. EnteroffsetYears(first_opened_date,3);
in the Value text box. This function will calculate 3 years ahead of the year specified in the given date. Click the OK button. The "Ahead_3_years" column is added to the Derivative Wizard.
Click the Add button to add a new column. The Add Column dialog box pops up. Enter name of the column as
offset_20days_before. Select Date as the Data Type. EnteroffsetDays(first_opened_date,-20);
in the Value text box. This function will calculate 20 days before the day specified in the given date. Click the OK button. The "offset_20days_before" column is added to the Derivative Wizard.
Click the Add button to add another new column. Enter name of the column as
offset_5months_before. Select Date as the Data Type. EnteroffsetMonths(first_opened_date,-5);
in the Value text box. This function will calculate 5 months before the month specified in the given date. Click the OK button. The "offset_5months_before" column is added to the Derivative Wizard.
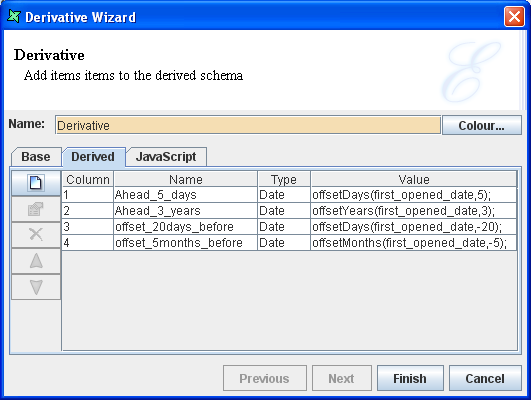
After entering the Column the Derivative Wizard appears as shown in Figure 4.26, “Completed Add Column Screen”. Click the Finish button in the Derivative Wizard.
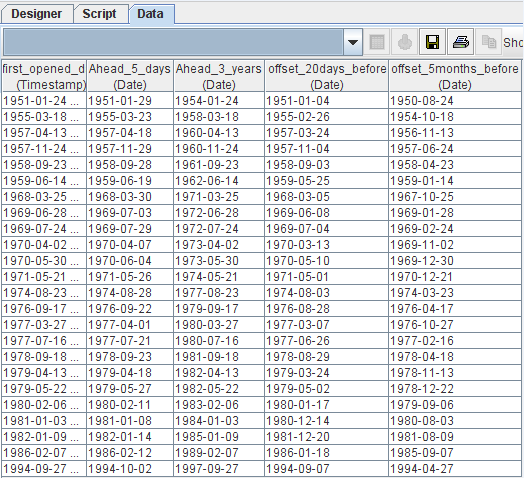
The output is shown in Figure 4.27, “Date Manipulations Result”. It can be seen that the offset dates are derived and displayed in new columns added to the data source.
Deriving a new column using the Java script function
This time, we'll calculate the percentage of Frozen area in the stores.
After connecting the Stores data source with the Derivative processor using the Derivative procedure given above open the Derivative Wizard properties.
The fields available in the data source are listed in the Base tab.
Select the JavaScript tab window and enter the following code:
function percent()
{
	percentage=frozen/store*100;
	return percentage;
}
Select the Derived tab window. Click the Add button the Add Column dialog box appears.
Enter the name of the derived field as frozen_percentage. Select long as the data type. Enter the function name
percent();
in the value text box and click the OK button.
The column is added in the Derived window of the Derivative Wizard. Click the Finish button and view the Result.
A new column frozen_percentage has been added to the data source, displaying the percentage of Frozen area in the stores.