The prerequisite for this case study is to have a .swf file that has the design of a slider. As a reminder, the slider wouldn't be seen in Repertoire Designer nor Remote Designer. The only way to see the slider work is to view the dashboard over the server.
In a newly created Perspective, drag the RangeSlider.swf file with range slider design into the blank space.
Select the datasource to be used. In this case study, we'll be using FruitSales.ds.
-
Click on
Next5 times. The skipped pages are for sorting and filtering of data. This page of the wizard is for the user to enter parameter values to be passed to the .swf file.
- nameField (mandatory) : the field that the slider represents
- x (optional) : the X location within the SWF rectangle. The default value is 0, which is about 5px from the edge due to SWF having 5px padding.
- y (optional) : the Y location within the SWF rectangle. The default value is 0, which is about 5px from the edge due to SWF having 5px padding.
- width (optional) : the width of the slider. The default is set to 100%. However, when entering a figure, do not use percentages. The unit of measurement for width is pixel.
- height (optional) : the height of the slider. The default is set to 100%. However, when entering a figure, do not use percentages. The unit of measurement for height is pixel.
- grouping (optional) : Three different values can be
entered.
None,OrderedandSorted. The default value isNone.Orderedwill list the figures in the order that it is in the datasource.Sortedwill list the numbers in ascending order. - labels (optional) : words to show on the slider.
This is only applicable when grouping is
None. - snapInterval (optional) : the number of units moved with each click on the slider.
- tickInterval (optional) : the incremental value of each marker on the slider.
For this case study, have 2000 as the value for
nameFieldand Sorted forgrouping.-
Click on
Finish. - Next, drag FruitSales.ds to the right of the SWF.
-
In the
Viewtab, selectElxRangeSlider, which is the .swf file, then theselectedoption. -
Click on
Finish. - Save the dashboard and go into the web interface of the server.
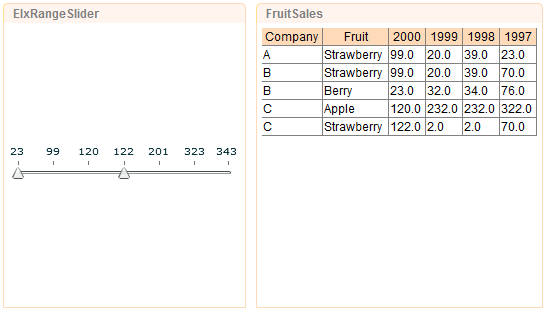
- Try dragging the slider to different figures. The table on the right will reflect records ranging between the chosen value, as in Figure 2.26, “SWF Range Slider”.