A report inside another report is known as sub-report. It is seen that one-to-many relationships are displayed by sub-reports where the main report usually displays one side of the relationship while the sub-report displays the many side of the relationship. There can be a single main report on which multiple subreports can be displayed. A same sub-report can be shared used across any number of main reports.
The Sub-report Wizard allows three values to be entered:
- Report, which may be left blank to indicate the current report
- Section, which should always be defined
- DataSource, which may be left blank to indicate the default datasource defined by the chosen section.
Sub-reports can be set to grow vertically to accommodate all the details that need to be shown, but will not grow horizontally. You need to make sure that the subreport is wide enough to show the full width of the subreport layout.
When a sub-report section is shown within a master report, you may choose to override certain characteristics. For example, if the master report has defined a style for fields, then the sub-report will use it instead of it's own. Similarly, if the sub-report section uses a datasource called MySubDataSource, then the master can define a new MySubDataSource that will override it. While rendering the sub-report, whenever any resources are required and they are identified by name (e.g. DataSource, PageSetup, Style etc.) then the renderer will first check the master report for a value, before checking the sub-report. Effectively, the master can be used to override the sub-report values. This allows the same sub-report to be used in multiple contexts and take on the characteristics of the master in each case.
One side-effect of the above behaviour is that, if you have a subreport which uses a page setup called "Default" (the default name) and your master report has a page setup also called "Default", then the master page setup will override the one defined in the SubReport. You should therefore check carefully that datasource names, page setup names and style names in your subreport are unique, otherwise the subreport when embedded will not look the same as the subreport if rendered separately.
The subreport may include multiple columns, but the report engine can only embed multiple columns if the page setup is defined as Across Then Down. Down Then Across columns cannot be handled by the subreport renderer.
Note
If a sub-report and a table is placed in the report layout and they access data from the same data source then they are both considered as discrete component and hence the data source is loaded each time.
Before creating a main report and a Sub-Report you have to add two data sources one for the main report say customers.ds(customer table) and the other for the sub-report say sales by customerid.ds(sales table) which contains a parameter custid used for filtering sales details based on customer_id. So enter a query in the SQL tab of sales as select * from sales_fact_1997 where customer_id=${cust_id);. Here's how to create a Sub-Report and include it in the main report.
Add a Blank report by following the procedure mentioned earlier and selecting sales by customerid.ds as the default data source which points to the sales table of the Mondrian database. While choosing the data source in the Report Wizard must confirm that the Propagate datasource parameters to report check box is turned on. So after the report template has been added it will be seen that the Parameter panel will contain a column with Name - cust_id, Value - ${cust_id} and the Enabled check box turned on.
Select section1 and invoke the Section Wizard. Select Group and Sort tab. Click on the Add button. In the Sort dialog window that appears select customer_id from the Name combo box, Ascending from the Sort Order combo box and Each Value from the Group On combo box. Select Show Group Header and Show Group Footer check box and click on the Ok button. Finally, click on the Finish button in the Section Wizard.
Select the Layout tab. Place a Horizontal Box element in the Section header. Append another two cells to it.
Select and place Label element in each cell and enter Customer_id, Store_id, Unit_Sales and Sales in the text field of the corresponding label element's field tab.
Select and place a Horizontal Box element in the Detail section and append another two cells to it.
Select and place a Data Field element in each cell. In the Properties Wizard that appears select customer_id from list of field. Similarly add the Data Field element and select Store_id, unit_sales and store_sales from the properties wizard of the corresponding elements.
Select and place a Horizontal Box element in the Group Footer:customer_id. In the first cell place a Label element and enter sum(sales) in the text field of the Properties Wizard and click on the Finish button. Place a Data Field in the next cell and in the Properties Wizard select Script from the Field Type combo box. Enter the following in the text field and click on the Finish button.
Sum_Sales=Data.getSum("store_sales").getValueOverGroup();Add a Blank report by selecting customers.ds as the default data source which points to the customer data source of the Mondrian database. Add another data source say Customer_Filter Subreport pointing to the sales by customer_id data source. After selecting the data source click on the next button. Enter "=customer_id" in the value column corresponding to "cust_id" in the Name column and click the Finish button.
Select the section section1 and invoke the Section Wizard. Select Group and Sort tab. Click on the Add button and select Customer_id from the Name combo box, Ascending from the Sort Order combo box and Each Value from the Group On combo box. Select Show Group Header and Show Group Footer check box.
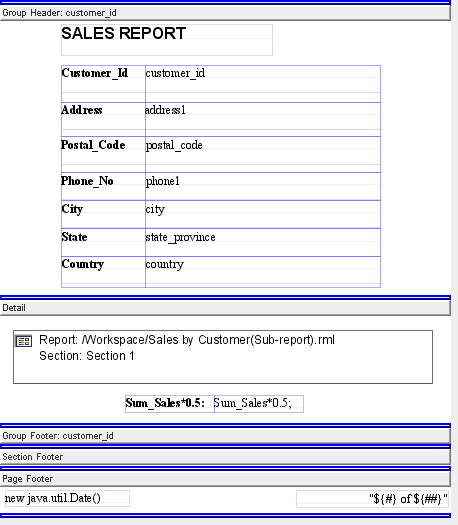
Select and place a Label element in the GroupHeader: customer_id and enter Sales Report in the text field of the Properties Wizard. Below it place a Vertical box element and append 5 cells to it. Place a horizontal box in each cell. Place label element in each cell of the Horizontal box element and enter Customer_id, Address, Postal_Code, Phone_No, City, State and Country in the text fields of the Properties wizard of corresponding Label element. Similarly, place Data field element in the second cell of each Horizontal box and select customer_id, address1, postal_code, phone1, city, state_province and country fields.
Select and place a Sub-Report element in the Detail section. The SubReport Properties Wizard appears. In this select the report Sales by Customer(Sub-report).rml from the Choose a Report dialog by clicking the button on the right of the text box. Select section1 from the section combo box and select Customer_Filter Subreport from the DataSource combo box.
Select and place a Horizontal box element below the SubReport element. In the first cell add a label Sum_Sales*.0.5. Place a Data Field element in the second cell of the box. In the Wizard select the Script Field type and enter Sum_Sales*0.5; and click on the Finish button.
Finally, invoke the Group Header Properties Wizard and enter Sum_Sales=0; in the OnRenderBegin text field of the Scripts tab. The layout appears as shown in Figure 4.10, “SubReport Example Layout”.
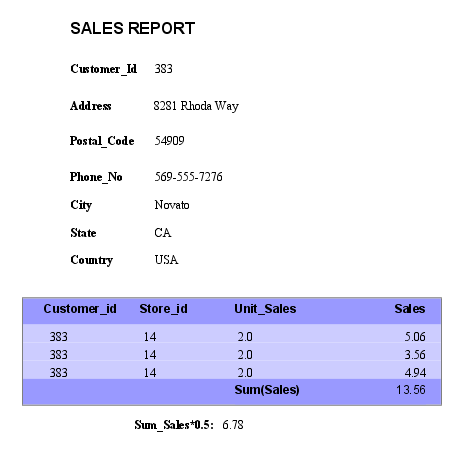
On rendering the report appears as shown in Figure 4.11, “SubReport Output”.

