This case study uses FruitSales.ds to create a simple example to demonstrate the use of Composite Chart.
- Create a new blank report, with any name, for example, sample and use FruitSales.ds as the datasource.
- Click on the icon for Composite Chart, and drag a space in the Section Header.
-
Select
Multiple AxesthenCategory Plot with Multiple Axes. -
On clicking
Nextis the wizard page to add the subplot. - Click on the Add icon, Chart Wizard opens. Select
Over All, then click onNext. -
Select
ColumnthenColumn 3D. ClickNext. -
For
Key, select Fruit. ForValues, add 1998 and 1999. -
Click
Finish. -
Follow step 5 to 8. Except when choosing the Chart type, select
Line, thenLine with Shapeinstead ofColumnand add 1997 and 2000 for Values. -
At the bottom of the wizard, check
Shared X (Range) Axis. -
Enter the name of the chart in
Name of Axisfor easy identification when viewing the chart. -
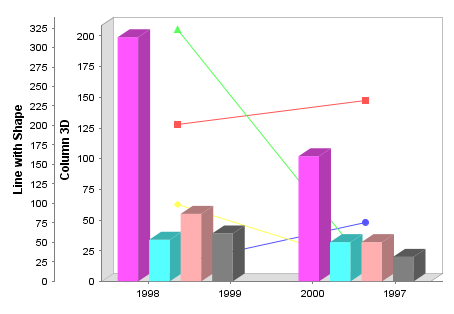
Click
Finishto finalize all the editing. The Composite Chart will appear like in Figure 4.37, “Composite Chart”.
Note
If the Composite Chart has a shared X axis and each of the charts has a name for their respective axes, the name entered inAxes tab,
X Axis field will be overwritten. On the other hand, if nothing is
entered for the respective axes, the name in X Axis will be the
name for all the X axes. This is applicable to Y axis as well.