In this case study, we will demonstrate how to use the Chart element drilldown function.
-
The first element to create, needless to say will be the Chart element. Drag FruitSales.ds
into the Perspective and select
Add Chart. After clicking onNext4 times, you will need to select a chart type. Select Pie followed by Pie chart thenNext. -
For the
Keytab, select Fruit. ForValuetab, select 2000. Exit the wizard by clicking onFinish. -
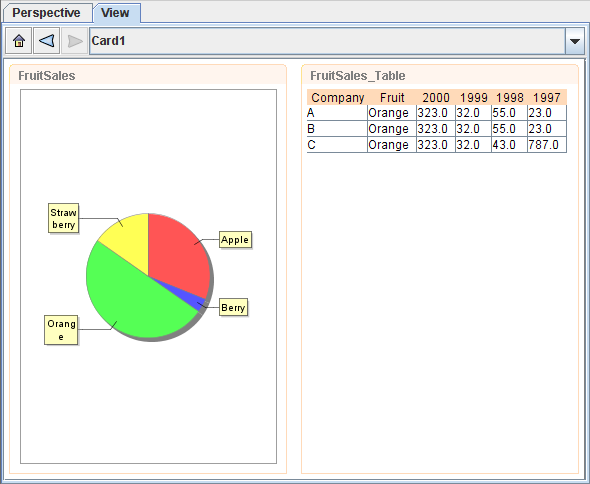
Next, drag FruitSales.ds again into the Perspective and place it on the right. This time, select
Add Table. On the first page of Add Content Wizard, click on theViewtab and select FruitSales thenSelected. Exit the wizard by clicking onFinish. - On the Perspective workspace, try clicking on the different slices on the Pie Chart. Since the Key of the Pie Chart is Fruit, when the user clicks on the different slice, the Table element will display the records with the selected Fruit, which is similar to Figure 2.22, “Results of Case Study 2”.